Website Change Monitoring Tool: A 2026 Developer Guide
Your RAG pipeline looked fine yesterday. Today retrieval quality is off, answers cite stale facts, and one source page now returns a polite shell of HTML while the full content loads through JavaScript after the browser boots. Nothing crashed. Your scraper still ran. Your vector store still updated. But the data changed shape underneath you.
That's the uncomfortable truth behind website monitoring for AI systems. Most failures don't arrive as obvious exceptions. They arrive as silent corruption: missing sections, reordered fields, hidden text blocks, duplicate fragments, legal pages that changed wording, product pages that now render client-side, or docs pages whose selectors no longer match. By the time the model starts giving bad answers, the root cause is already buried a few pipeline stages upstream.
A good website change monitoring tool isn't just for price alerts or competitor tracking anymore. For AI and LLM teams, it's part of data reliability. If you ingest from the open web, you need to know when a source changed, what changed, and whether that change should trigger re-extraction, re-chunking, re-embedding, or a human review.
The Silent Data Killer Why Monitoring Matters
The ugliest pipeline failures are the quiet ones.
A docs site changes its sidebar structure. Your crawler starts capturing navigation text as if it were core content. A vendor moves release notes behind a client-rendered component. Your fetcher stores an almost empty page. A pricing table gains a new row, but your parser still maps columns using the old layout. The output looks valid enough to pass downstream checks, so nobody notices until the model starts answering with half-truths.
That pattern is common enough that it should change how teams think about source monitoring. Industry analysis cited by AiMultiple's website change monitoring research says over 60% of enterprise data pipelines fail or require manual correction due to unmonitored source website changes. For AI systems, that failure mode is worse than a hard crash because the model can turn broken inputs into confident output.
Silent failure is worse than explicit failure
When a page returns a 500, your job queue notices. When a selector stops matching, many pipelines just produce thinner content. When a layout change duplicates sections, embeddings still get generated. The system keeps moving, but the semantic quality drops.
That's how context poisoning starts in practice. Not always through malicious content. Often through ordinary website changes that your ingestion layer didn't detect or classify.
Practical rule: If a source page matters enough to scrape, it matters enough to watch.
Monitoring also helps with a related problem: content hygiene. If a page suddenly starts repeating boilerplate, injecting banners into the main content area, or changing canonical blocks, you need a way to detect that before your cleaning stage spreads junk everywhere. Teams working on duplicate detection in extraction pipelines already know this pattern. Duplicates rarely begin as a database problem. They often begin as a page-change problem.
Manual checks don't survive the modern web
The old habit was simple: keep a shortlist of important URLs and check them once in a while. That worked when websites were mostly server-rendered and slow-moving. It breaks on modern stacks.
Today, pages mutate through frontend deployments, experiments, asynchronous components, personalization, and client-side rendering. By the time someone notices a retrieval issue in production, the original version that caused the problem may already be gone.
A website change monitoring tool gives you the missing event stream. Not just “this URL exists,” but “this content changed at this time, in this region of the page, in a way that probably matters.” For AI teams, that signal should sit next to crawl logs, parser errors, and embedding jobs. It's operational telemetry for content, not a nice dashboard feature.
How Website Change Monitoring Tools Work
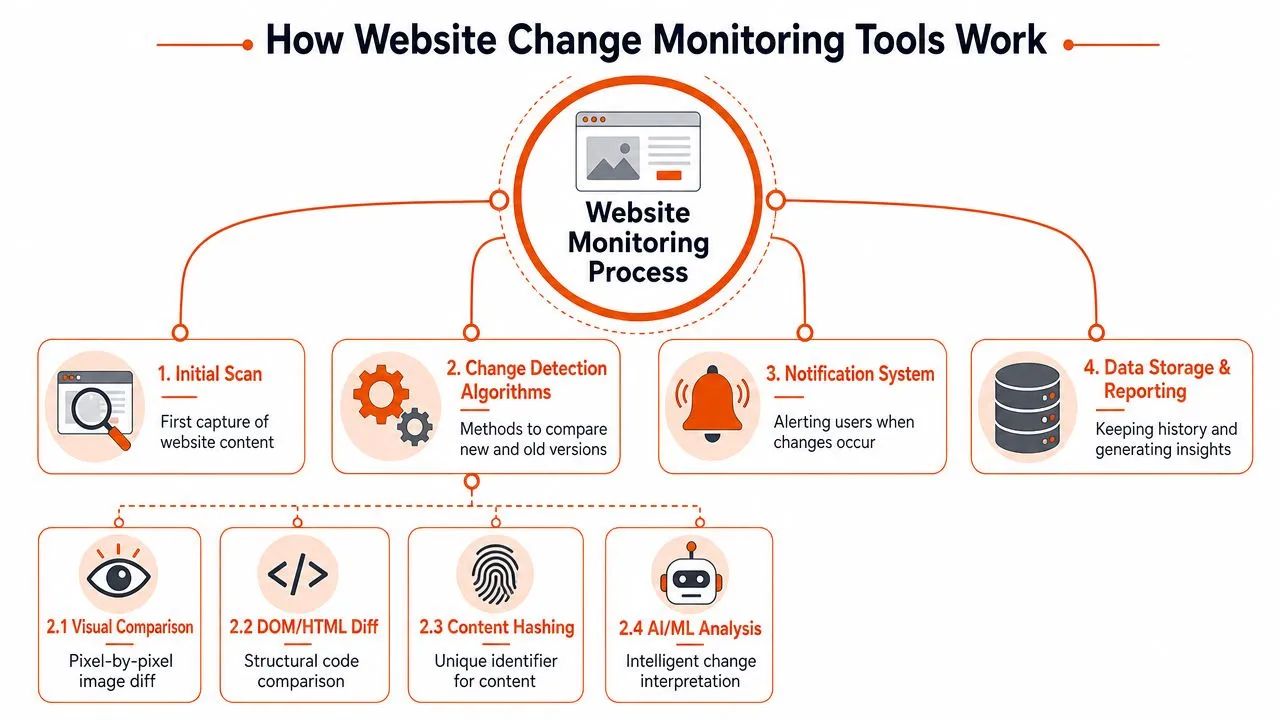
A website change monitoring tool compares a page now against the same page earlier. The interesting part is what it compares, because that determines whether you catch real changes or drown in noise.
The easiest way to think about it is this: raw HTML is the ingredient list, rendered content is the cake, and a screenshot is the plated dessert. Depending on your use case, you may need one, two, or all three.
Three layers of detection
Raw HTML diffing is the simplest method. Fetch the source, store it, compare it later. This is fast and cheap, but it's noisy and often misleading. You'll catch template edits, token churn, inline scripts, and other implementation details that users never see.
Rendered DOM or text diffing is what most serious monitoring needs. The tool loads the page, lets scripts run, then compares the visible DOM or extracted text. This better matches what a user reads and what your extractor should ingest.
Visual diffing compares screenshots. It catches design shifts, image swaps, and layout changes that text diffs miss. It's useful for QA, brand monitoring, and situations where the presentation itself is the signal.
Each layer solves a different problem:
- HTML diffs help when you care about implementation changes, hidden metadata, or structured markup.
- Rendered text diffs help when you care about meaning, documentation changes, policy edits, and knowledge ingestion.
- Visual diffs help when a page can change materially without much text changing.
If you're integrating alerts into data systems, clean diffs matter more than pretty diffs. A webhook carrying a focused JSON payload is more useful than an email that says “something changed.”
For teams that need machine-readable change output, it helps to look at patterns like diff-oriented API responses instead of email-first tools.
Why browser rendering matters
This is the dividing line between outdated monitoring and modern monitoring.
Advanced tools use full browser engine rendering, such as headless Chrome or Firefox, to execute JavaScript and capture dynamic content from SPAs rather than treating the page like static HTML. PageCrawl's discussion of JavaScript-capable monitoring explains why this matters: client-rendered DOM changes won't be detected by naive scrapers that only fetch the initial response.
That matters because many websites now load the meaningful content after hydration, route transitions, or async requests. If your monitor checks only the first HTML response, it may confidently report “no change” while the visible content changed completely.
A monitor that can't render the page the way a browser does is often monitoring the wrong artifact.
That problem gets more severe in AI ingestion. If your retrieval stack consumes rendered content but your monitor compares raw HTML, your observability layer and your data layer are looking at different worlds. You want those worlds aligned.
One more practical detail: rendering alone isn't enough. Good monitoring also needs wait conditions, stable selectors, and some concept of noise suppression. Otherwise every rotating banner, login prompt, or cookie dialog becomes an alert storm.
Key Features to Evaluate in a Monitoring Tool
Most website monitoring products look similar in a feature table. Add URL, pick interval, receive alert. That tells you almost nothing about whether the tool will survive production use.
The real test is whether the tool can tell the difference between a meaningful source change and normal page motion. For developers and AI teams, signal quality beats dashboard polish every time.
What separates hobby tools from production tools
The first thing to evaluate is targeting precision. Can you monitor the whole page, the main content area, or a specific element? Full-page monitoring is useful at the start because it exposes what moves. Element targeting becomes important once you know exactly what matters. The trap is going element-first too early. Fragile selectors break the moment a frontend team ships a redesign.
Then look at rendering fidelity. If the tool can't reliably handle JavaScript-heavy sites, it will miss changes on modern properties. That's not an edge case anymore. It's the baseline.
Alerting is next. Email is fine for personal use. Teams usually need webhooks, because webhooks let you trigger re-crawls, create tickets, invalidate cached chunks, or route a human review task. For AI workflows, notification should be machine-first.
You also want to inspect the output format. Some tools send a screenshot, some send highlighted text, some send a generic “change detected” event. For downstream automation, the best output is structured and minimal: URL, timestamp, changed region, old value, new value, and enough metadata to decide what to do next.
Operator's check: If you can't connect the monitor to a queue, a workflow engine, or your ingestion service, it's not infrastructure yet.
Scale matters too. Many tools work for a handful of URLs and then fall apart operationally. You need bulk setup, templates, organization, and reliable execution across large watchlists. If your team monitors documentation, pricing pages, policy pages, and knowledge sources across many domains, batch workflows become mandatory. That's where services built around batch scraping and large URL sets tend to fit better than one-monitor-at-a-time products.
There's also an adjacent need for AI teams and marketers: understanding how public-facing pages shift over time in ways that affect discoverability. If that's part of your workflow, QuickSEO's guide to AI visibility for marketers is a useful companion read because it frames monitoring as part of how brands appear inside model-driven discovery systems, not just search.
Feature Evaluation Checklist
| Feature | What to Look For | Why It Matters for Developers |
|---|---|---|
| Rendering method | Real browser execution, not raw HTTP only | Lets you monitor what users and extractors actually see |
| Scope control | Full page, content area, CSS selector, visual region | Reduces noise and supports targeted workflows |
| Diff quality | Structured text diff, DOM-aware change output, visual evidence | Makes alerts actionable instead of vague |
| Webhooks and API access | Event delivery your systems can consume | Enables automated reprocessing and incident routing |
| Noise filtering | Ignore banners, nav, timestamps, repeated boilerplate | Prevents alert fatigue |
| History and snapshots | Stored versions you can inspect later | Helps debug when a pipeline started drifting |
| Bulk operations | Batch creation, templates, grouped monitors | Necessary when monitoring lots of URLs |
| Anti-bot resilience | Stable access to protected or brittle sites | Keeps monitors useful on hard targets |
| Output cleanliness | JSON or clean text rather than full noisy HTML | Better for parsers, jobs, and LLM pipelines |
A strong website change monitoring tool doesn't just notice differences. It helps you decide whether a difference matters, and it does that without forcing a human to inspect every alert manually.
Common Use Cases for Developers and AI Teams
Website monitoring started as a practical way to track changing pages. That use case still holds. The difference now is that developers and AI teams depend on those pages as live data sources, not just things to glance at in a browser.
The old use cases still matter
Competitor tracking is the obvious example. Product messaging changes, pricing pages shift, comparison tables get rewritten, and launch pages appear before announcements hit social channels. For teams doing market intelligence, monitoring is often the fastest way to catch movement. If you're building a formal workflow around that, Statiko's write-up on understanding competitor moves in real-time is useful because it treats page changes as operational signals rather than casual research.
Compliance and legal monitoring is another one. Privacy policies, terms pages, and regulatory pages change unannounced. Those changes can affect contracts, onboarding flows, and internal documentation. A diff history gives legal and product teams something concrete to review instead of relying on “we think the page changed last week.”
Developer teams use monitoring for docs pages, changelogs, API references, status pages, and integration partner pages. If a dependency changes its authentication docs or deprecates a field in a guide before the SDK catches up, a monitor often sees it first.
Why AI teams need monitoring even more
For AI systems, the highest-value use case is source integrity.
A RAG pipeline only looks current if the source pages stay stable enough to extract, chunk, and embed reliably. When those pages change structure, your retrieval layer can degrade without any obvious exception. Monitoring gives you a chance to gate ingestion based on change type, not just crawl success.
A practical pattern looks like this:
- Content source changes materially. Trigger re-extraction and re-embedding.
- Navigation or cosmetic elements change. Ignore, or record without indexing.
- Page structure changes sharply. Route for parser review before refreshing the corpus.
- High-trust source changes unexpectedly. Flag for human approval to avoid poisoning the context store.
That last one matters. If your system blindly refreshes the vector store every time a page changes, you can replace high-quality context with malformed or low-value content. Monitoring lets you put a checkpoint between “source changed” and “new source enters retrieval.”
There's also a strong SEO and publishing angle. Teams that care about content quality use monitoring to catch content drift, unexpected edits, or pages that suddenly accumulate duplicate fragments. In those cases, content monitoring workflows become part of editorial QA as much as engineering.
For LLM systems, freshness without validation is risky. Monitoring works best when it sits in front of ingestion, not after it.
That's the shift. Website change monitoring is no longer just about getting alerts. It's about controlling how live web changes enter automated systems.
Implementation Patterns and API-First Monitoring
The first version most engineers build is a cron job and a diff.
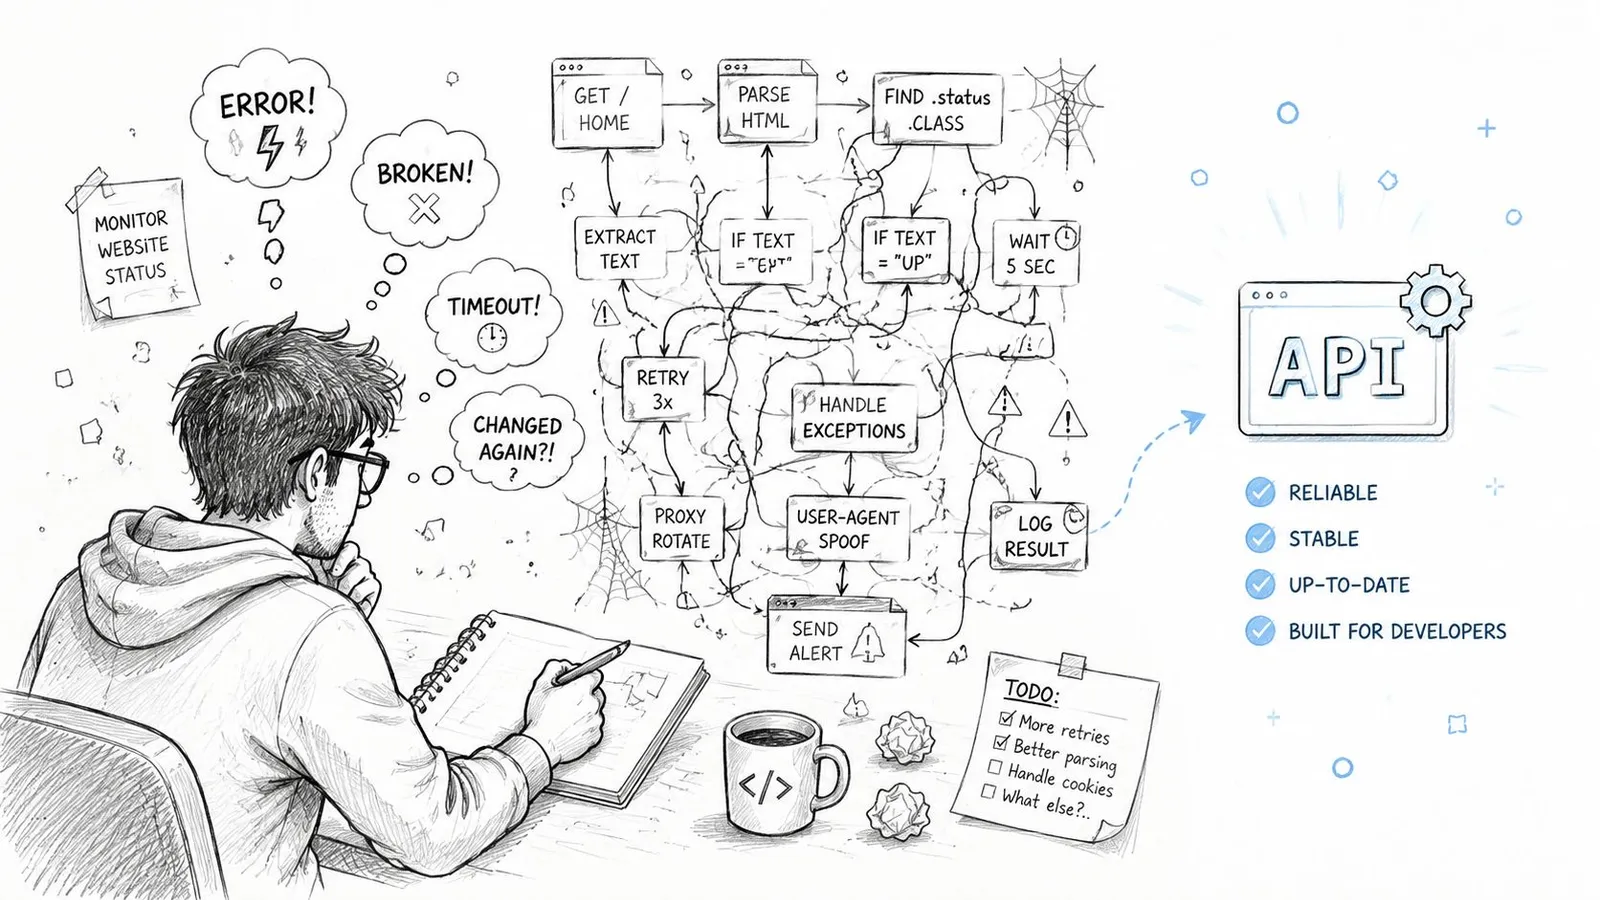
Fetch HTML. Hash it. Compare against the last snapshot. If the hash changed, send a Slack message. It works for a small demo, and it fails in exactly the places production systems care about.
The naive build path
The problem isn't that building is impossible. It's that the work expands fast.
First you realize raw HTML hashes are useless on dynamic pages. So you add a headless browser. Then you need wait logic for async content. Then proxies. Then retry behavior. Then storage for snapshots. Then DOM normalization so trivial changes don't trigger alerts. Then some way to compare text regions. Then webhook delivery. Then dashboards because nobody wants to grep logs to inspect what changed.
Soon you're maintaining a monitoring product instead of using monitoring as a capability.
The rough internal architecture usually ends up with these parts:
- Scheduler to decide when each URL gets checked.
- Fetcher or browser worker to load the page.
- Normalizer to strip noise and extract the target content.
- Diff engine to compare current and previous snapshots.
- Classifier to decide whether the change is meaningful.
- Notifier to emit alerts or trigger automation.
- Storage layer for snapshots, metadata, and audit history.
Every box in that list hides edge cases. Anti-bot systems block requests. Browser versions drift. Pages timeout. Screenshots cost money. Selectors break. Some targets need cookies or sessions. What looked like a script becomes a service.
Build it yourself if monitoring is your product. Don't build it yourself if monitoring is just one dependency inside a larger system.
A practical API-first pattern
For most teams, the cleaner approach is API-first monitoring: treat change detection as an external capability and plug it into your data pipeline.
The shape is straightforward:
- Register a watch for a URL or content scope.
- Receive structured change events through a webhook or polling endpoint.
- Decide whether the event should trigger re-crawl, re-extraction, re-embedding, or review.
- Persist the result next to your source metadata.
A minimal Python pattern looks like this:
import requests

API_KEY = "YOUR_API_KEY"

payload = {
    "url": "https://example.com/docs/page",
    "mode": "content",
    "notify_via": "webhook",
    "webhook_url": "https://your-app.com/webhooks/content-change"
}

resp = requests.post(
    "https://api.webclaw.io/watch",
    headers={"Authorization": f"Bearer {API_KEY}"},
    json=payload,
    timeout=30
)

print(resp.status_code)
print(resp.json())
Your webhook handler can then route different classes of changes differently:
def handle_change_event(event):
    page_type = event.get("page_type")
    change_scope = event.get("change_scope")
    significance = event.get("significance")

    if significance == "low":
        return "record_only"

    if page_type == "docs" and change_scope in ["main_content", "api_reference"]:
        enqueue_reingestion(event["url"])
        return "reingest"

    if page_type == "policy":
        create_human_review_task(event["url"])
        return "review"

    if change_scope == "layout_only":
        return "ignore"

    enqueue_reingestion(event["url"])
    return "reingest"
The important part isn't the syntax. It's the separation of concerns. The monitoring layer detects and reports. Your application decides how to respond.
If you want a concrete reference for the watch pattern, look at API-driven watch setup rather than designing the whole lifecycle from scratch.
A short walkthrough helps if you're wiring this into an automation stack:
The teams that get the most value from a website change monitoring tool don't treat alerts as inbox events. They treat them as data events. That's the key architectural move.
A Decision Framework Build vs Buy vs API
Choosing a monitoring approach gets easier when you stop asking “which tool is best” and start asking “where should this capability live.”
When building makes sense
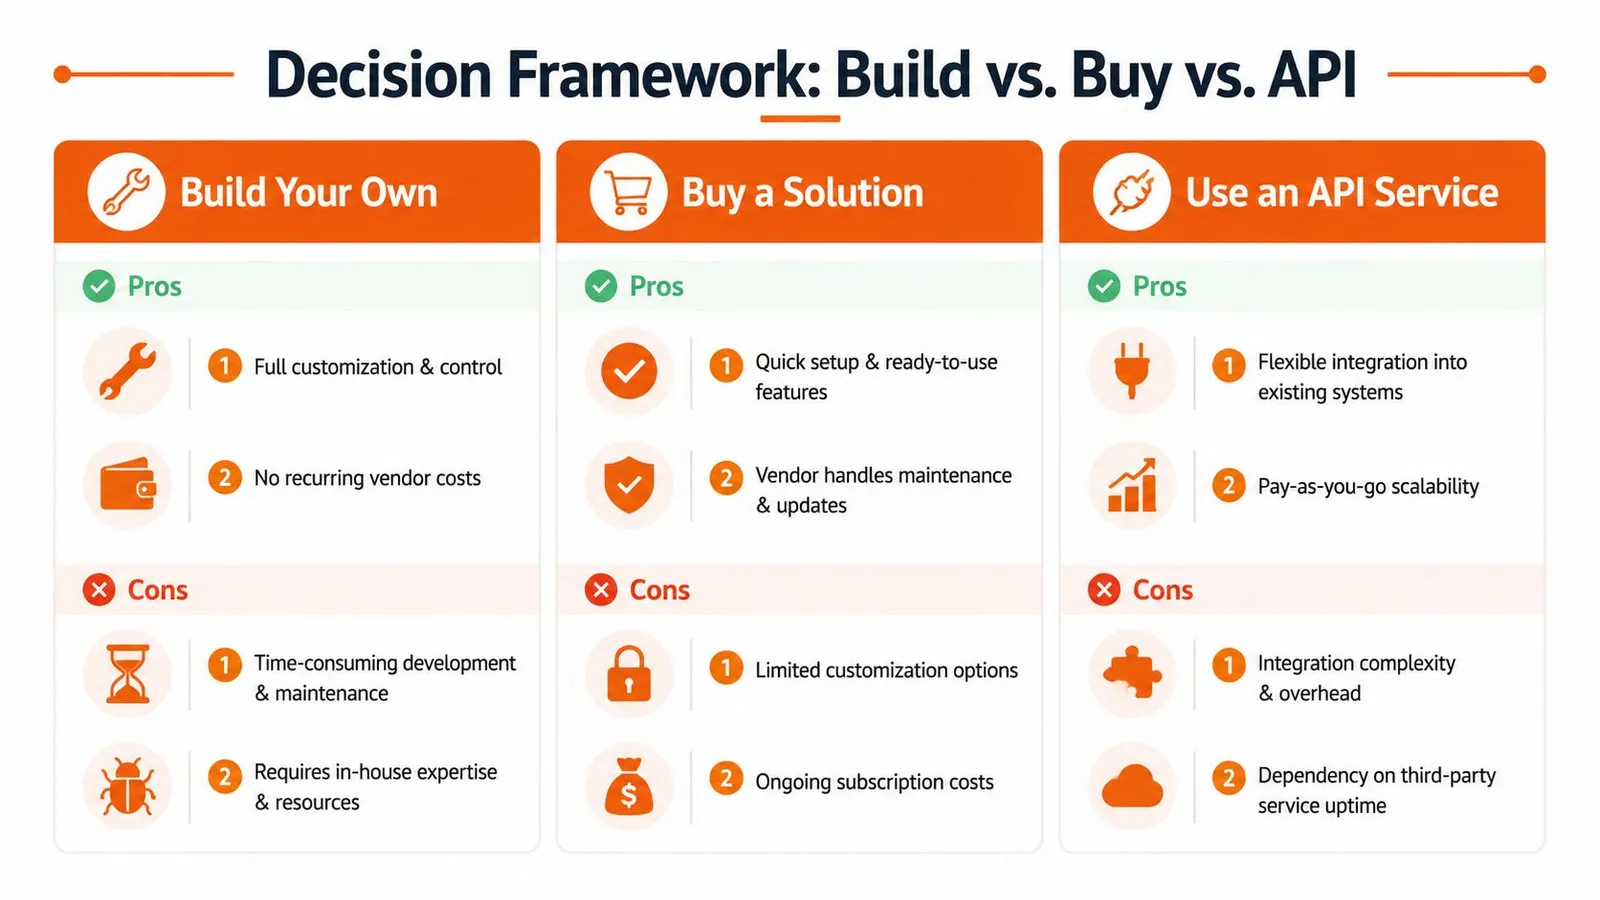
Build your own system if monitoring is core intellectual property, or if your requirements are unusual enough that external tools can't model them. That usually means highly custom authenticated flows, niche extraction rules, or environments with strict control requirements.
The upside is control. You own rendering logic, storage, event semantics, and deployment. The downside is obvious to anyone who has maintained browser automation at scale. You also own breakage, upgrades, blocking, and every odd site-specific edge case.
When buying a GUI tool is enough
A hosted visual tool is fine when the consumer is a human. Product managers tracking competitor pages, legal teams watching policies, or marketers following landing page edits can move quickly with an off-the-shelf interface.
That path starts to strain when developers need deep integration. Once you want monitors created from code, events routed to internal queues, output normalized for downstream jobs, or changes linked to ingestion policies, GUI-first tools become limiting.
When an API is the right answer
If your team is building software around changing web data, an API usually fits best.
It gives you hosted reliability without forcing your workflow into a dashboard. You can create monitors programmatically, attach them to source records, pipe events into orchestration systems, and keep monitoring inside your own application logic.
Here's the simple decision test:
- Choose build if monitoring itself is strategic and you're prepared to operate the stack.
- Choose buy if humans mainly consume the alerts and integration needs are light.
- Choose API if software consumes the alerts and monitoring must plug into larger systems.
The more your system depends on changing web sources, the less sense it makes to keep monitoring outside your architecture.
For AI teams, that answer is usually API. You don't just need to know that a page changed. You need to decide what that means for retrieval quality, corpus freshness, and source trust. That decision belongs in code.
Conclusion The Future of Data Integrity
Website monitoring used to sound like a peripheral utility. For AI systems, it isn't peripheral anymore.
If your product ingests content from the web, then source volatility is part of your reliability problem. Pages change structure. Content moves behind JavaScript. Legal text gets revised. Docs drift. Navigation bleeds into extracted content. None of that is rare, and most of it won't trigger an obvious failure on its own.
A website change monitoring tool gives you the missing control point between “the web changed” and “our system accepted the change.” That's what matters for RAG pipelines. Not just freshness, but validated freshness. Not just snapshots, but actionable diffs. Not just alerts, but decisions about whether to reprocess, review, or ignore.
The practical progression is predictable. Teams start with scripts. Then the scripts accumulate browser logic, retries, snapshots, alerting, and painful maintenance. Eventually they either adopt a GUI tool for basic visibility or move to an API model that fits engineering workflows.
For serious data pipelines, especially ones feeding LLMs, the long-term answer is usually the same: monitoring has to behave like infrastructure. It needs reliable rendering, clean change output, and integration points your systems can consume directly.
Treat source change events the way you treat logs, metrics, and failed jobs. They belong in the operational loop.
If you're building AI retrieval pipelines or agent systems that depend on live web content, Webclaw is worth a look. It's built for extracting clean, token-efficient content from hard websites, and it also supports change tracking between snapshots so you can turn website changes into structured events instead of brittle ad hoc scripts.